Canada’s merchandise trade balance up due to reduced exports
Share
Share

Statistics Canada’s latest international merchandise trade report shows that Canada’s merchandise trade balance with the world widened from a revised deficit of $287 million in July to a deficit of $1.1 billion in August.
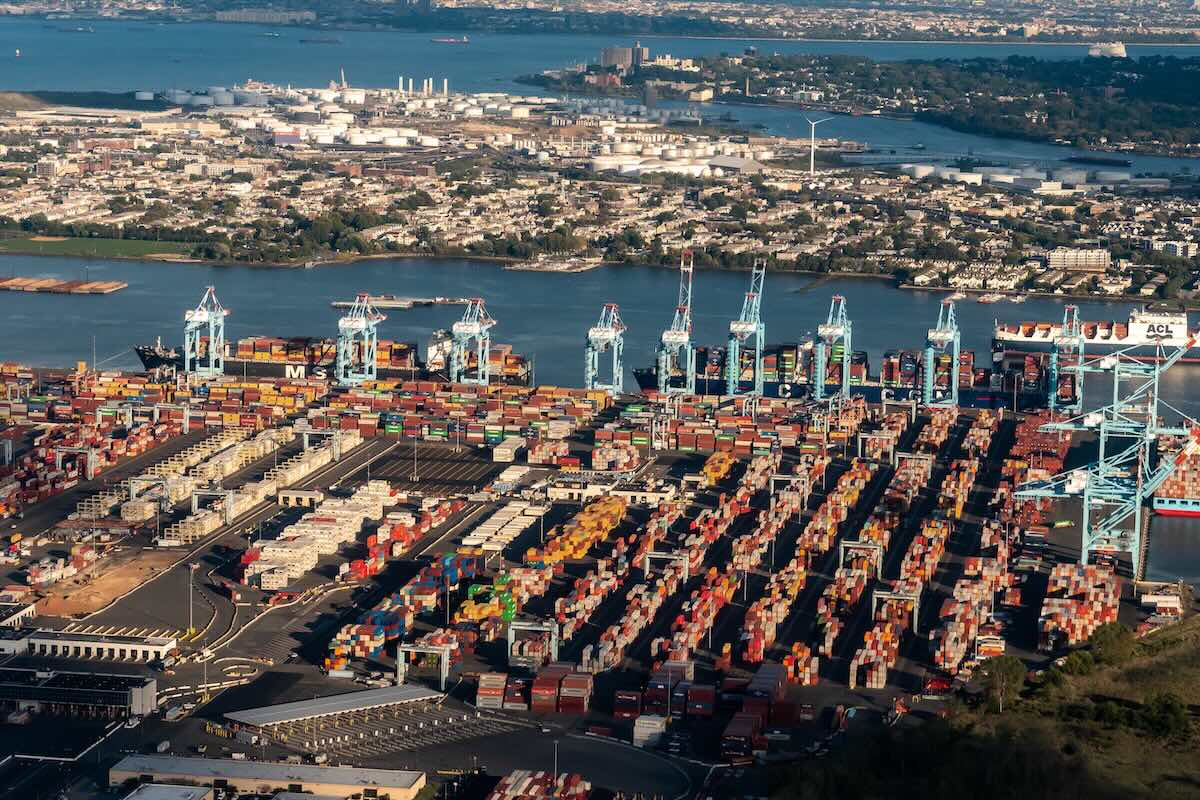
The increase results from merchandise exports falling one per cent, while imports inched up 0.3 per cent during the month of August, with total exports down one per cent for the second consecutive month.
Overall, six of the 11 product sections posted declines. Prices played a significant role in the monthly movement in exports, as exports edged up 0.1 per cent in real (or volume) terms in August.
Exports of energy products were down three per cent, posting the largest decrease in August, mainly on lower exports of crude oil. This decrease was mainly attributable to lower prices for crude oil exports in August, as concerns over oil demand exerted downward pressure on crude oil prices.
Exports of forestry products and building and packaging materials fell 5.5 per cent to $3.8 billion in August, its lowest level since July 2023. After two consecutive monthly increases, pulp and paper exports dropped 12.9 per cent in August, more than offsetting the increases in the previous two months. Lower exports of pulp and paper to China and the United States were the biggest contributor to the decline. Stats Canada said the decrease could be due to rail transport work stoppages in Canada in August, since a large share of these products are exported by rail.
Exports of motor vehicles and parts increased 5.1 per cent and partly offset the decrease in total exports in August. Exports of passenger cars and light trucks were up 6.1 per cent, contributing the most to the increase, mainly due to higher production of light trucks in Canada in August. This follows two consecutive months of sharp declines. Despite the monthly increase, exports of passenger cars and light trucks were down 19.9 per cent in August compared with the high observed last October. This recent downward trend is due in part to lower production in Canada.
Exports of farm, fishing and intermediate food products rose four per cent in August, also partly offsetting the decline in total exports. The growth in August almost completely offset the decrease observed in July. Canola exports were up 72.9 per cent in August, driven by higher exports to China.
Offsetting movements in imports
After falling 1.4 per cent in July, total imports edged up 0.3 per cent in August. Overall, six product sections were up and five were down. In real (or volume) terms, total imports increased 0.4 per cent in August.
Imports of motor vehicles and parts rose 2.4 per cent in August and were the largest contributor to the overall growth. Imports of passenger cars and light trucks rose 5.6 per cent, the largest increase in August. This growth coincides with higher production of light trucks and sport utility vehicles in the United States in August. The monthly movement in imports of passenger cars and light trucks in August follows a sharp 17.6 per cent decline in July.
In August, imports of industrial machinery, equipment and parts were up 3.8 per cent and saw an increase in value similar to that of imports of motor vehicles and parts. Widespread gains were observed in the different product subcategories. After falling 15.9 per cent in July, imports of logging, construction, mining and oil and gas field machinery and equipment increased 10.4 per cent, accounting for almost one-third of the growth in the product section in August. Despite this monthly gain, this product group was down 20.8 per cent year over year.
Imports of consumer goods fell 2.8 per cent in August, partially offsetting these increases. Following two consecutive months of growth, imports of pharmaceutical products were down 17.5 per cent and were the main contributor to the decline in this product section in August. Lower imports of active pharmaceutical ingredients from Ireland contributed the most to the decline.
The trade surplus with the U.S. shrinks on lower exports
Exports to the U.S. were down 4.3 per cent in August, partly due to lower exports of energy products. Meanwhile, imports from the U.S. increased 0.9 per cent. As a result, Canada’s merchandise trade surplus with the United States narrowed sharply from $10.5 billion in July to $8 billion in August.
Exports to countries other than the U.S. rose 10.3 per cent in August. Higher exports to the United Kingdom (unwrought gold) contributed the most to this gain. This increase follows a sharp decline in exports of unwrought gold to the United Kingdom in July. Exports to Switzerland (unwrought gold) were also up in August.
Imports from countries other than the U.S. fell 0.7 per cent in August. Lower imports from Ireland (pharmaceutical products) and Mexico (passenger cars and light trucks) were partly offset by higher imports from Switzerland (unwrought gold).
Canada’s trade deficit with countries other than the U.S. narrowed from $10.8 billion in July to $9.1 billion in August.
In August, monthly service exports were up 0.5 per cent to $16.9 billion. Meanwhile, imports of services decreased 0.6 per cent to $18.2 billion.
When international trade in goods and services are combined, exports were down 0.7 per cent to $81.2 billion in August, while imports edged up 0.1 per cent to $83.6 billion. As a result, Canada’s total trade deficit with the world went from $1.8 billion in July to $2.4 billion in August.


Leave a Reply