Containers flood into U.S. ports at record levels
Share
Share
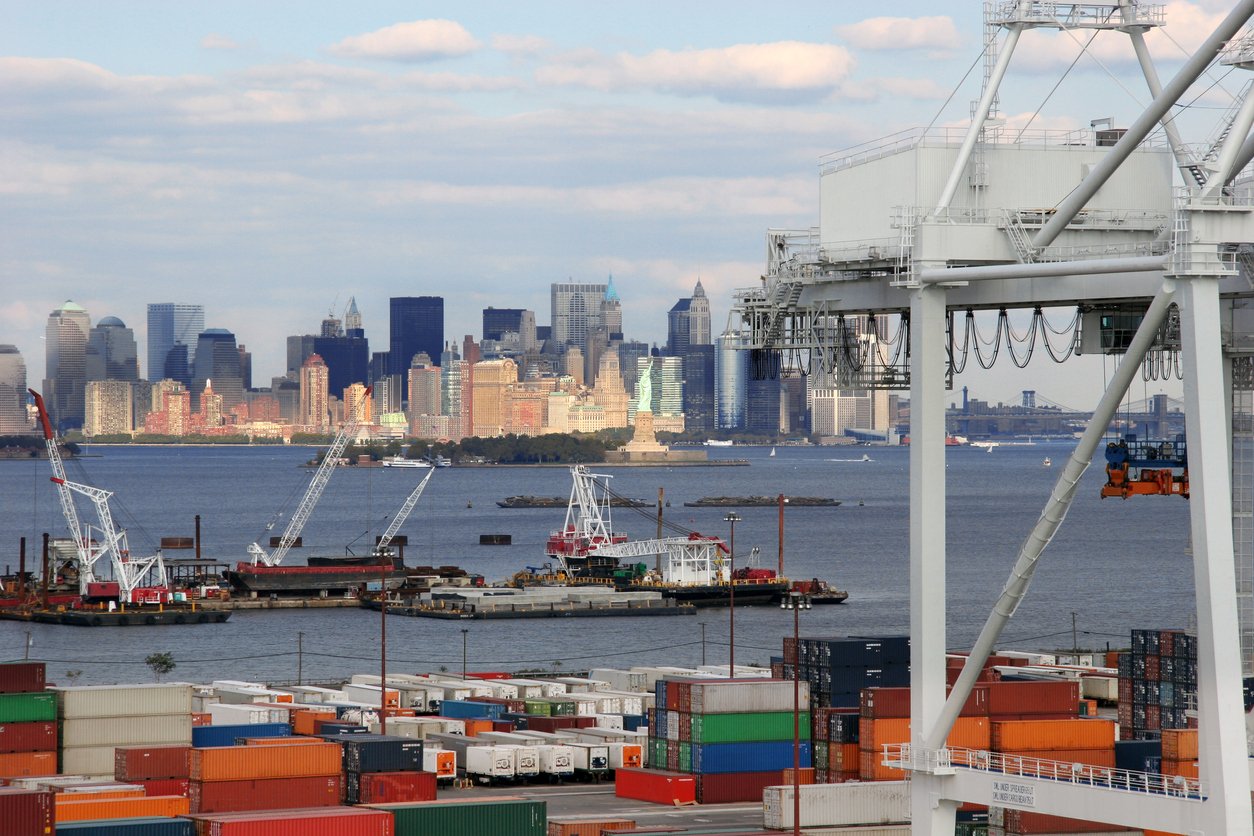
Import volumes at U.S. ports continued at record levels in June, still above previous 2021 levels.
Descartes Systems Group’s July report on the ongoing global shipping crisis shows that while volumes are lower than May 2022’s all-time record, they remain above the level that has caused port congestion and delays for the last 15 months.
A number of factors such as the economy, inflation, high fuel costs and an increase in ships waiting off ports continue to make managing supply chain risk challenging.
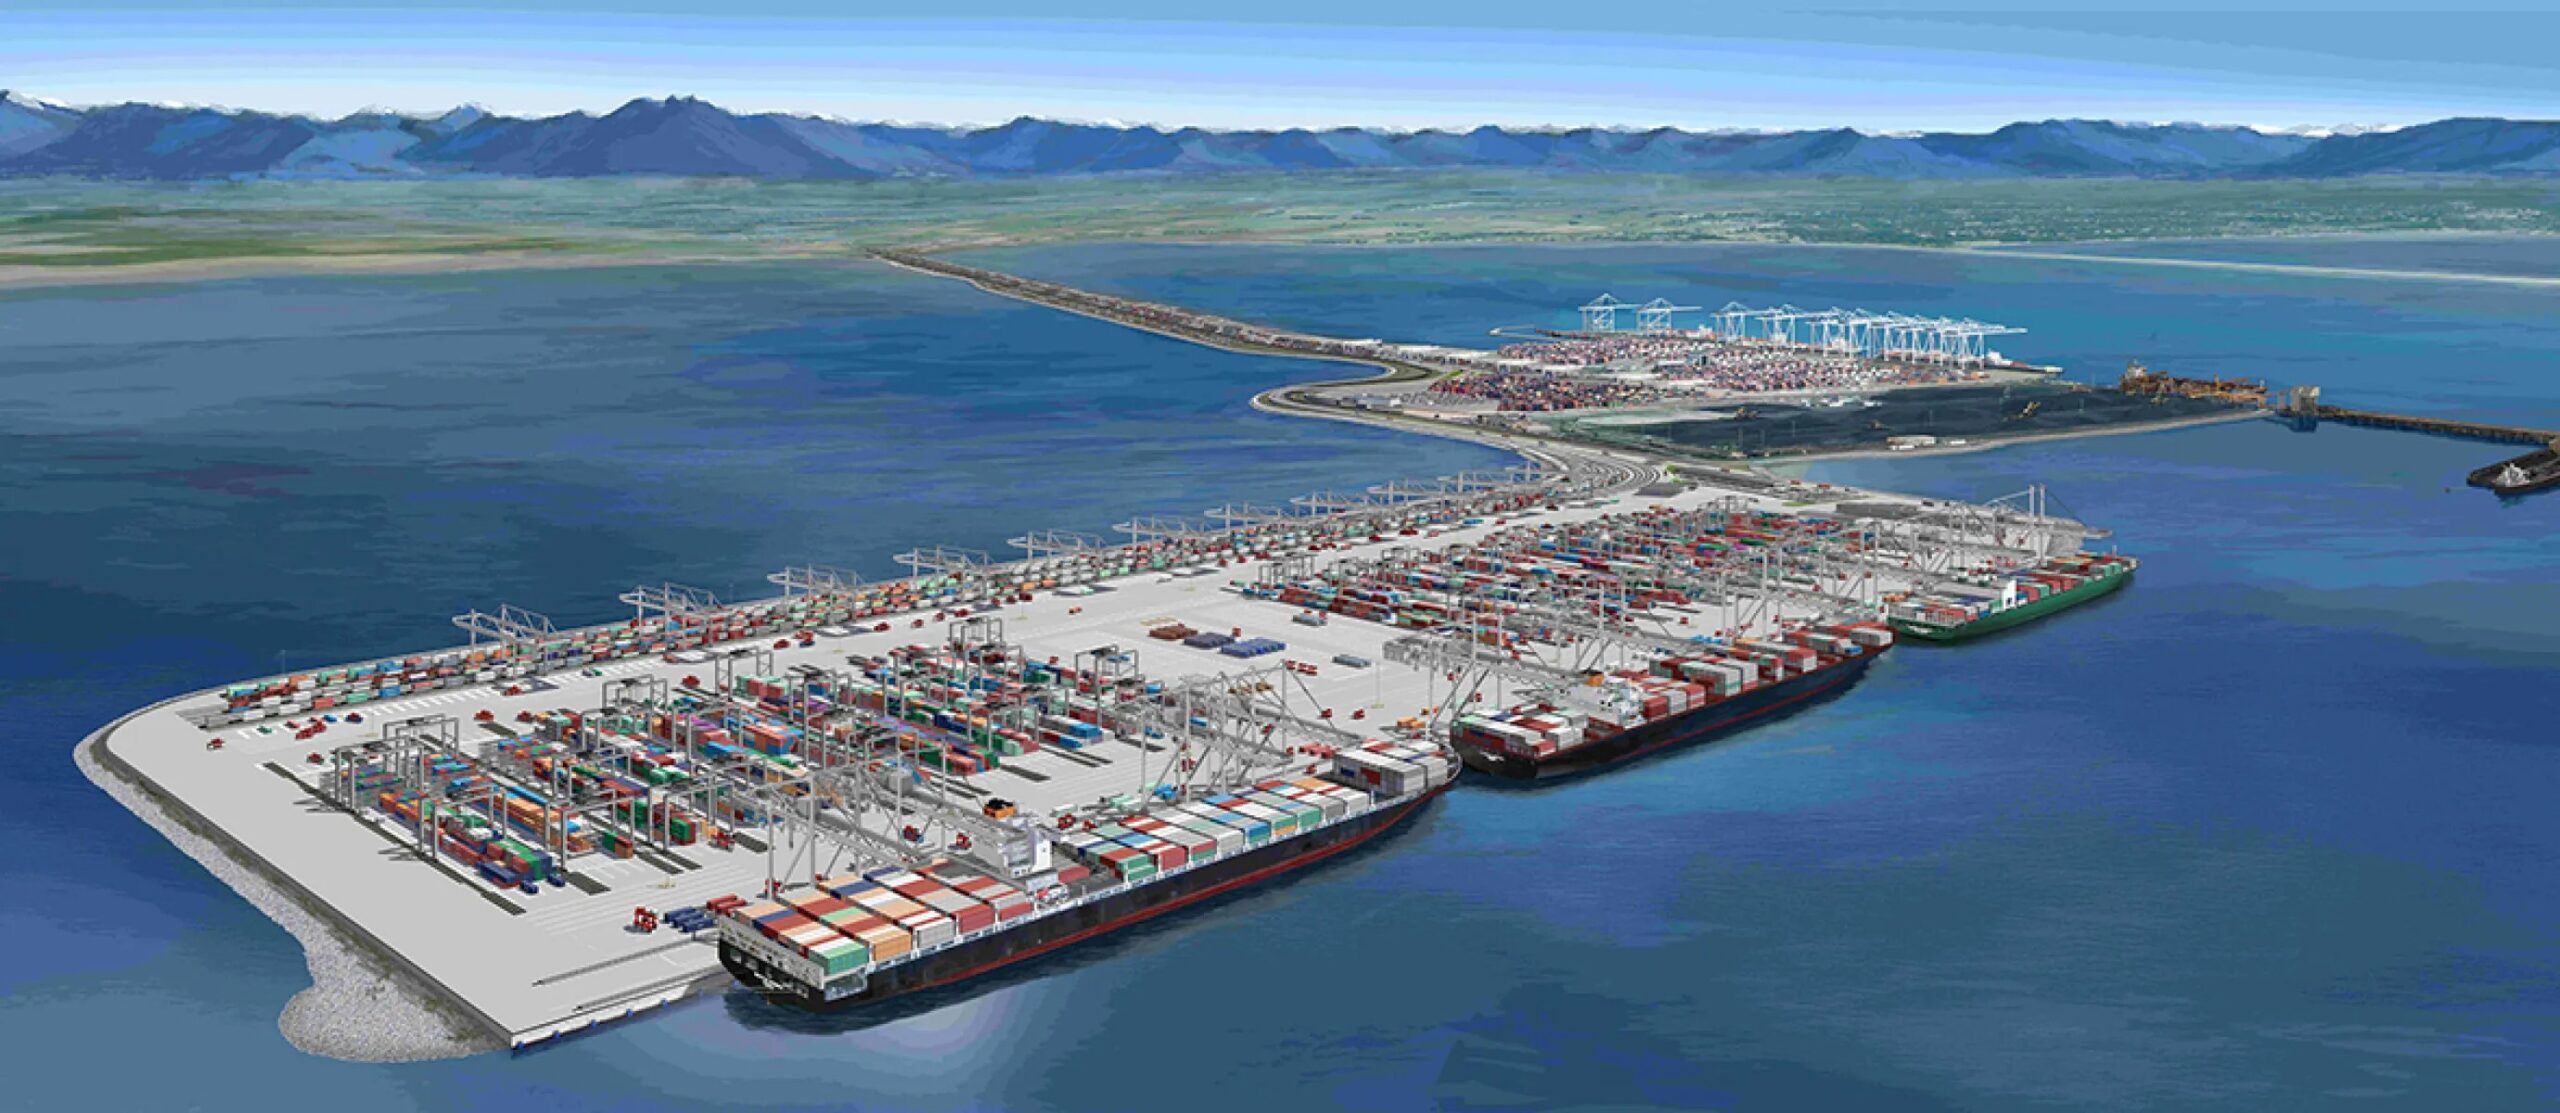
At the halfway mark of 2022, container imports into the U.S. set another monthly record, as TEU volume was up three percent from May 2021 to 2,480,946 and up 26 percent from pre-pandemic June 2019. Every month in 2022 has been a record month when compared to previous years. June container import volume was down five percent versus May 2022, but in a pattern consistent with previous years other than at the start of the pandemic in 2020.
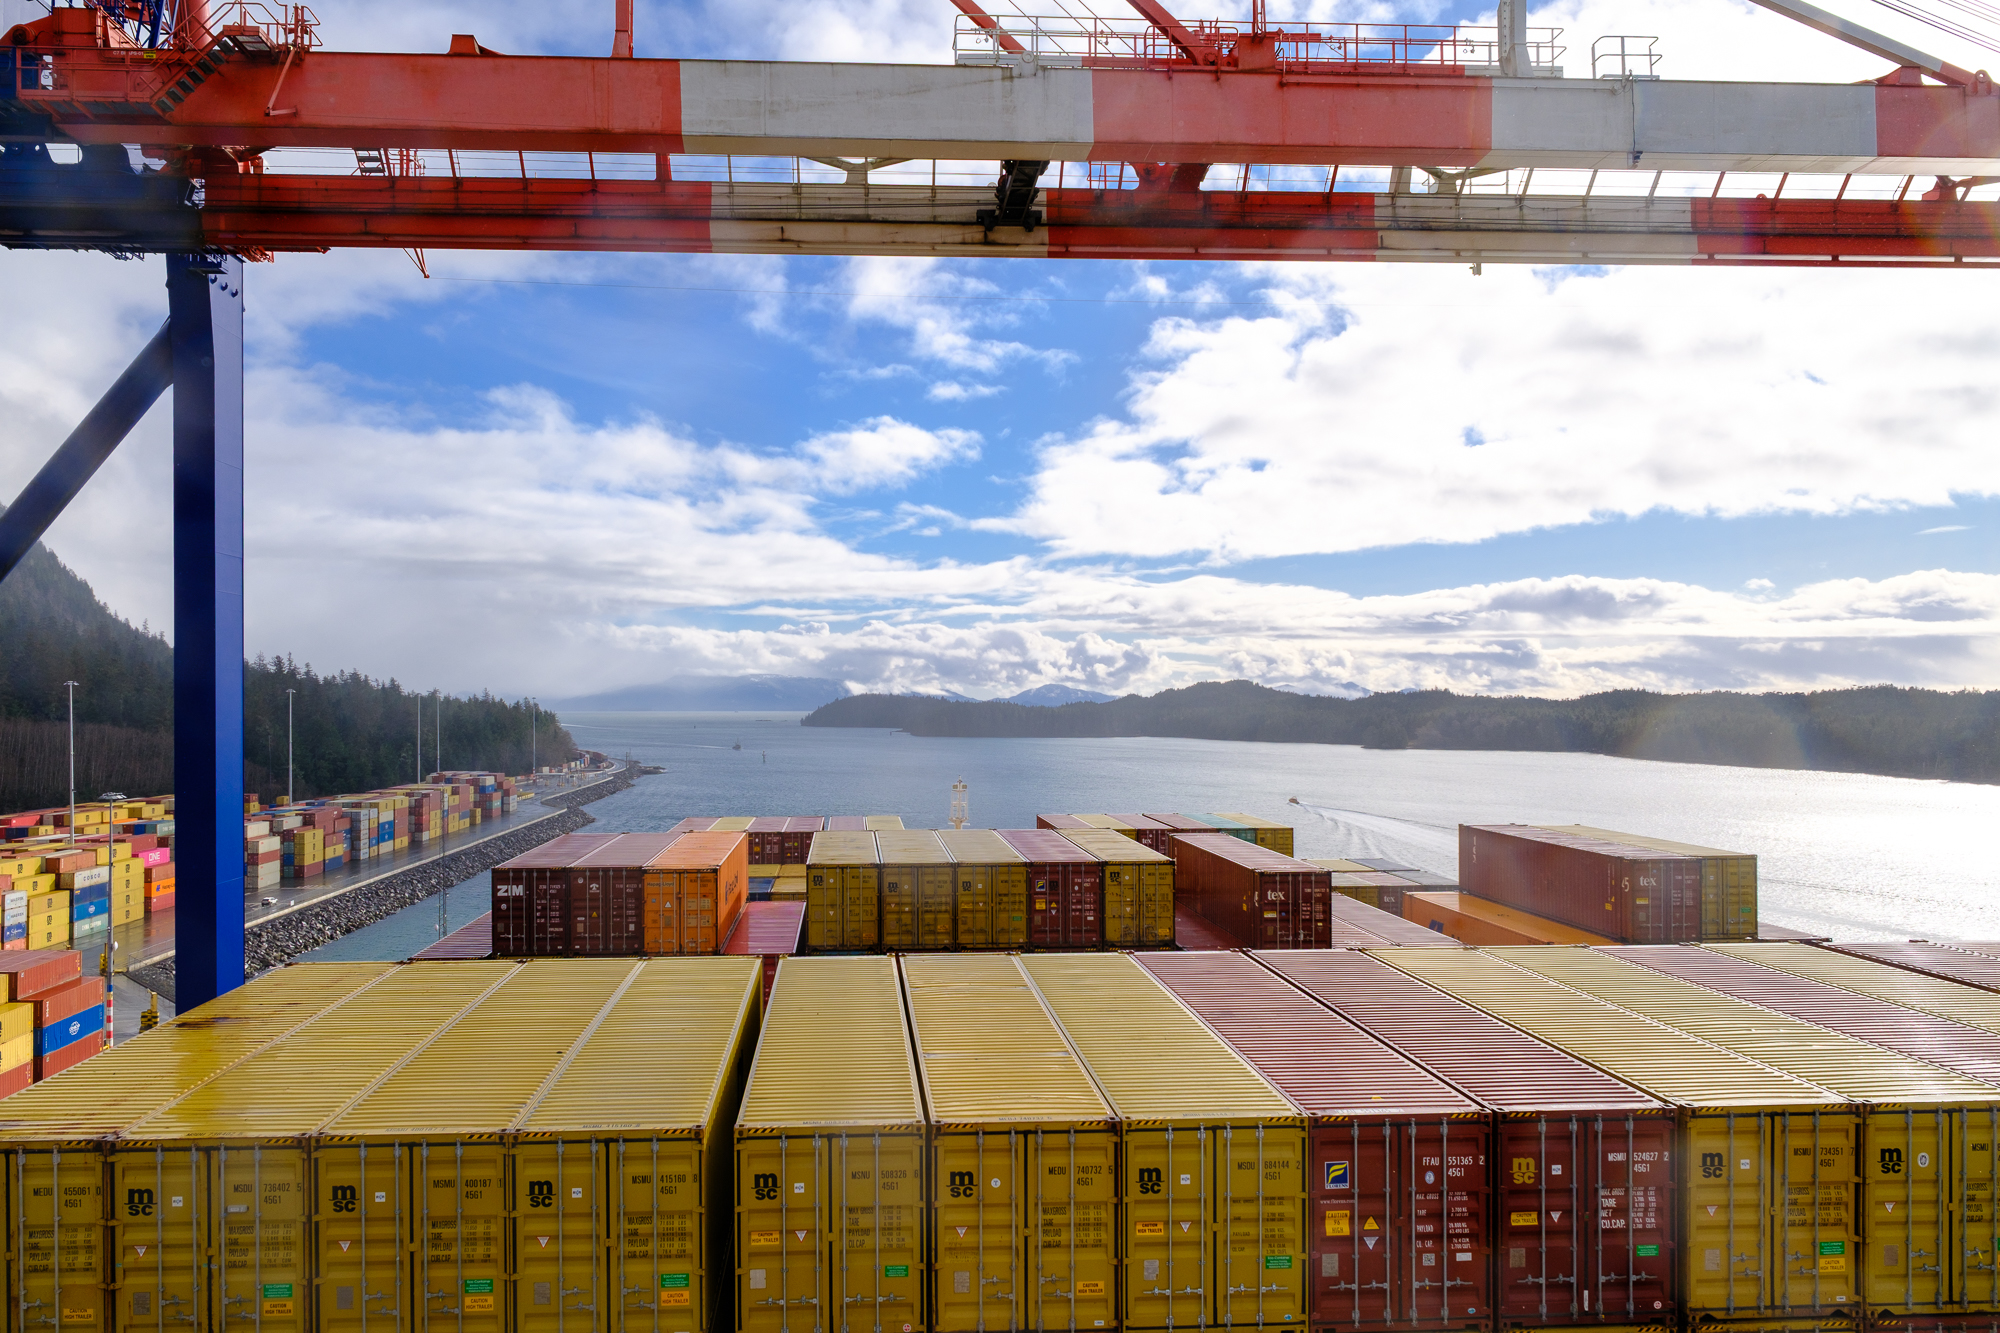
“The continuation of record U.S. container imports in the first half of 2022 has not relieved the pressure on ports,” said Chris Jones, executive vice-president industry and services at Descartes.
“The regression of wait times at East and Gulf Coast ports and the increase in ships waiting on the water portend future congestion and supply chain disruptions.”
Average Wait Times (in days) at Top 10 U.S. Ports
|
Port |
May |
June |
|
LOS ANGELES |
9.3 |
8.4 |
|
LONG BEACH |
8.8 |
8.0 |
|
NEW YORK/NEW JERSEY |
13.6 |
13.7 |
|
SAVANNAH |
10.6 |
12.8 |
|
NORFOLK |
12.0 |
10.6 |
|
HOUSTON |
11.5 |
11.7 |
|
CHARLESTON |
10.6 |
11.1 |
|
OAKLAND |
11.8 |
8.6 |
|
SEATTLE |
11.4 |
9.8 |
|
TACOMA,WA |
8.3 |
8.6 |
Source: Descartes Datamyne
The July report is Descartes’ twelfth installment since beginning its analysis in August 2021.


Leave a Reply